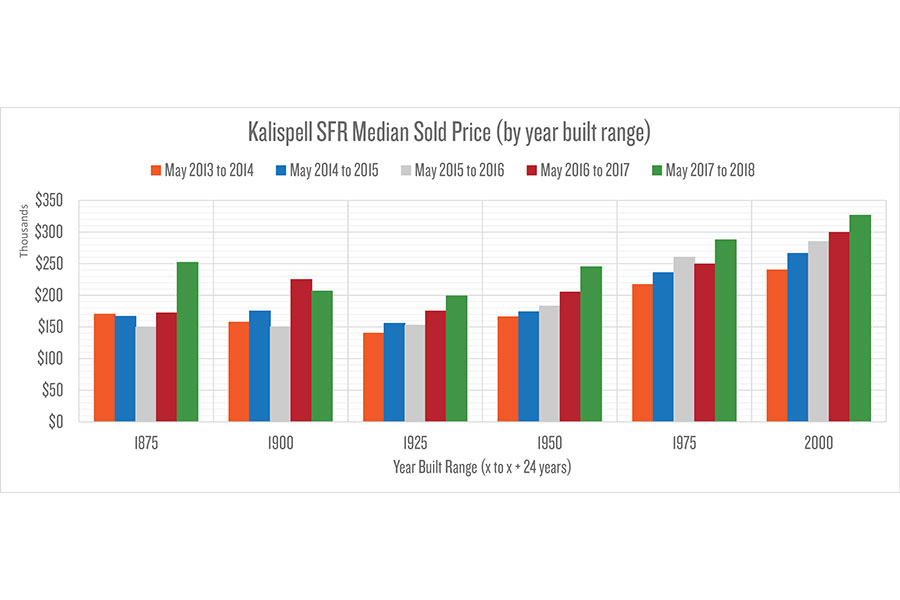
This chart shows the recent median annual sale price trends of single-family residences in Kalispell, grouped by generation (25 years) of original construction. Each grouping of bars represents incremental annual sales activity for homes built within a specific 25-year period (x to x+24). There’s an obvious five-year step-up trend for all groups since 1925, and a nice spike in the most historic group this past year.
How about annual quantities sold, over the past five years (oldest group to newest): (2, 2, 4 1, 4), (28, 41, 27, 24, 36), (89, 86, 110, 102, 98), (65, 80, 95, 84, 93), (191, 200, 188, 200, 207), and (235, 279, 309, 312, 368). The two most recent vintage groups sell by far the greatest quantities.
Median sold price per square foot? Nice annual stair steps upward for 1900 and newer groups — they keep selling for more each year. Recent 12 months (oldest group to newest: $108, $126, $121, $122, $133, $157).
Median days from listing to contract? Nice annual stair steps downward annually for 1900 and newer groups — they keep selling faster. Recent 12 months (oldest group to newest): 147, 26, 12, 17, 32, 35.
Sold price as a percentage of original list price? For 1925 and newer groups: 95-98 percent (shallow uptick over the past five years).
Richard Dews is CEO of Glacier Flathead Real Estate, a Flathead-based real estate software and services company.