Just for fun, let’s take a look at how home values in Flathead County have performed against the stock market and the price of gold. We all have friends and family who want to tell us how to invest, so this week’s graphs illustrate the past history of three commonly recommended alternatives.
These graphs use the median home price in Flathead County for the home price index. The stock market is represented by the S & P 500 index at the end of each year. Gold is represented by the price per ounce at the end of each year.
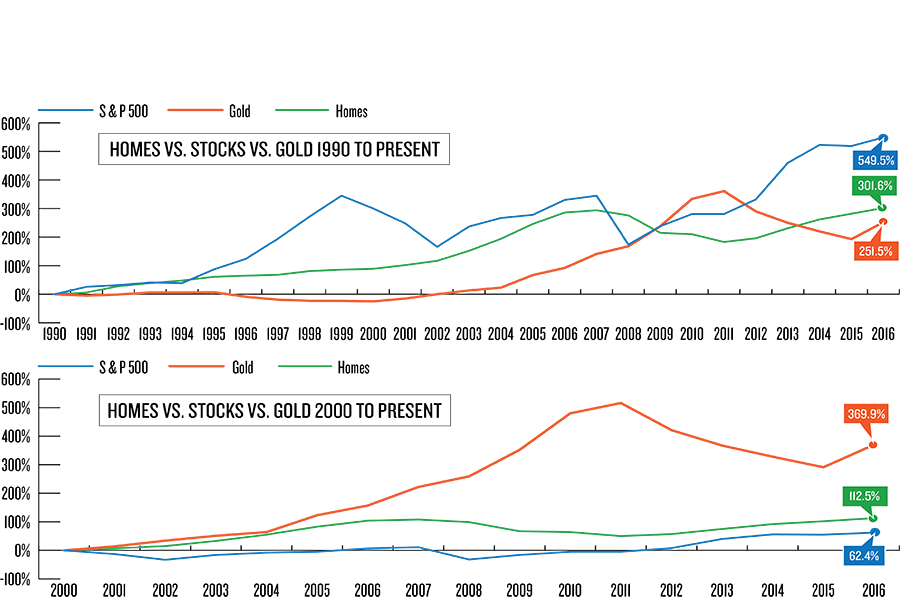
The first graph shows the percentage price changes from 1990 to the present. The stock market has increased around 550 percent, the price of gold has increased around 250 percent and the median home price in Flathead County has increased a little over 300 percent. Flathead home prices have outperformed gold, but not the stock market over the last 26 years.
The second graph uses 2000 as the base year and shows a different story. The stock market increased around 62 percent, gold increased around 370 percent and the median home price increased around 112 percent. Over the last 16 years, Flathead home prices outperformed the stock market, but not the gold market.
If we just take a look at the last six years, since 2010 we find that the stock market increased 70 percent and the gold market declined 19 percent. Again Flathead home prices were in the middle with a 29 percent increase in value.
Dependent upon the time period analyzed, markets do change. What has been consistent is that Flathead home prices have been much less volatile then either the stock market or the gold market, but have still performed competitively over time with both.