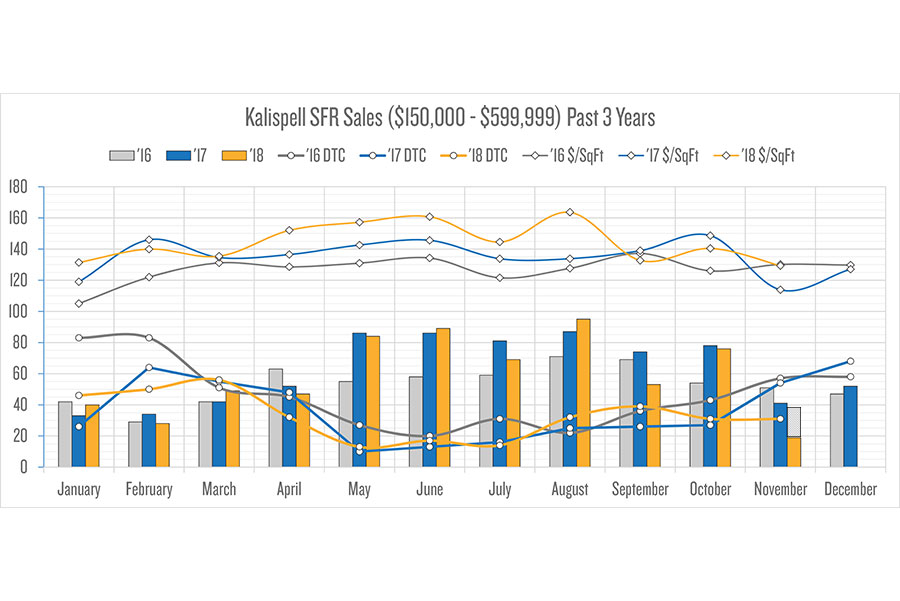
In Kalispell, over the past three years, how many homes ($150,000 to $599,999) sold in which calendar month (see chart)? Granted, these are the sold dates — not the contract dates (which usually precede the sale date by about 45 days). Are they selling faster or slower? See the median days from listing to contract (DTC) lines. Are they selling for more or less per square foot? See the median cost per square foot ($/SqFt) lines. I used gray for 2016, blue for 2017, and gold for 2018.
Since I only have data through mid-November for 2018, I had to infer the potential quantity to be sold during the second half of November 2018 (see hashed upper gray bar). Fewer sell in winter; May through October are the more active months. You can’t really generalize that prices (per square foot) always peak in summer — look at 2017, which “peaked” in February, June AND October. April through August shows reasonably consistent rises year-over-year; March and September are incredibly similar, both between those two months and over the three years.
Richard Dews is CEO of Glacier Flathead Real Estate, a Flathead-based real estate software and services company.