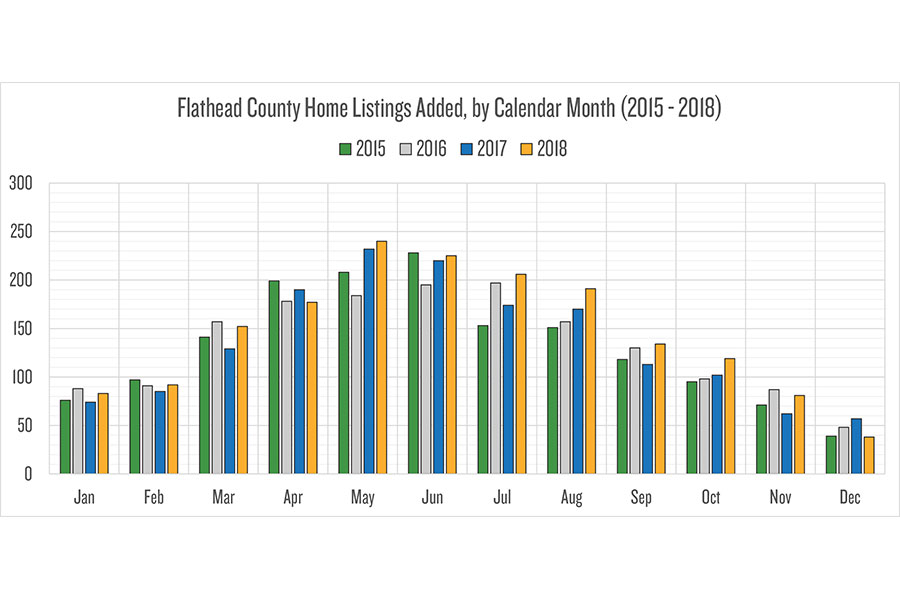
When do the most homes hit the market, by calendar month (see chart)? The chart shows the quantities of listings added, by month, for homes listed for prices between $150,000 and $599,999 over the past four years. If you assumed that most enter the market in the summer, you’d be wrong; most are added to the market during the spring (fewest are added during the winter).
Note: When I wrote this column, I only had data through December 20, 2018 — so I limited the chart data consistently for all years to December 1-20. It turns out that about 80 percent of the total December listings were added by the 20th of the month, for 2015-2018. Final whole-month December numbers for 2015-2017 were 49, 67 and 67, respectively.
So which year had the most listings added? Through December 20 each year: 1,576 (2015), 1,610 (2016), 1,608 (2017) and 1,738 (2018).
Richard Dews is CEO of Glacier Flathead Real Estate, a Flathead-based real estate software and services company.