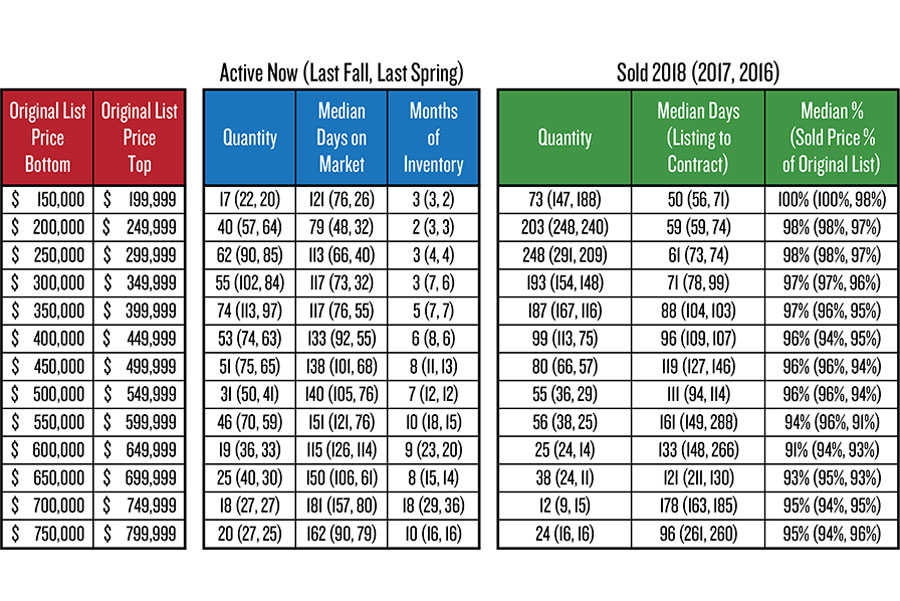
Back on Oct. 24, I gave a then-present residential single-family market snapshot comparison, showcasing then-active counts and comparing spring and fall snapshots (May vs. October 2018).
This week (see table), let’s compare the present active market to the snapshots taken last fall and spring (October and May). Let’s also compare the sold activity of the past three years (January-December). There’s about three months inventory available in the cheapest four segments; segments $450,000 and above show a winter thinning of months of inventory, compared to last fall and spring (segment inventories below that price have remained pretty lean).
The median days on market column shows accruing fermentation of listings which didn’t sell quickly, in prior season snapshots.
How about past quantities sold? The lowest-priced segment sold half as many units in 2018 than in 2017 — cheap is harder to come by. The $300,000 – $699,999 segments just keep climbing in sales quantity, year over year. Most segments show a quickening of being snapped up by buyers (days from listing to contract). Most segments continue to “grow or hold” their percentage of original list prices when they sell.
Richard Dews is CEO of Glacier Flathead Real Estate, a Flathead-based real estate software and services company.
