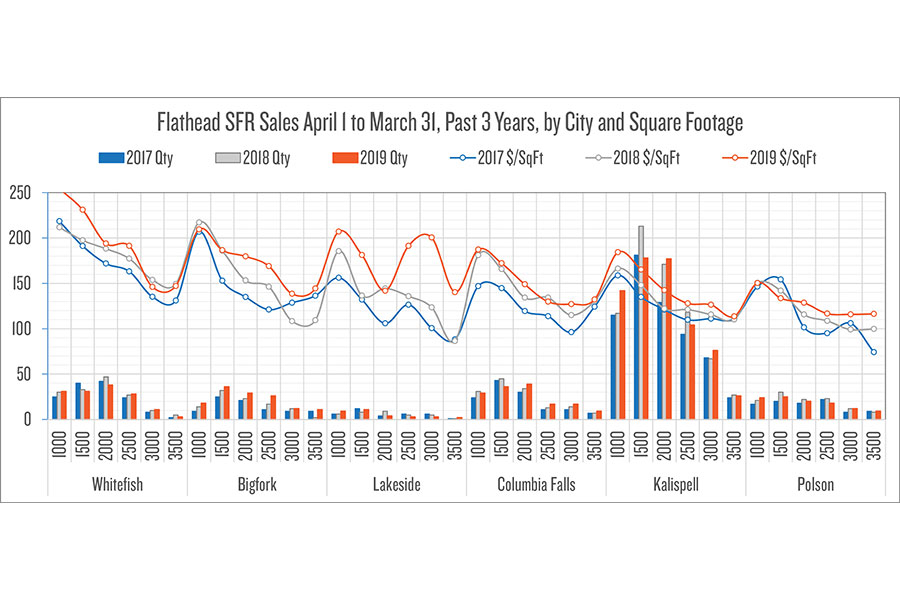
On Nov. 14, 2018, and on Jan. 23, 2019, this column showcased charts that detailed three years of single-family residence sales activity. Let’s take a new look (shifting the periods forward one quarter), for home sales (sold prices $150,000 to $699,999) these past three years – periods of April 1, 2016 – March 31, 2017; April 1, 2017 – March 31, 2018 and April 1, 2018 – March 31, 2019.
Let’s compare the quantity of sales, by city and square footage range (500-square-feet segments (like 1,000 to 1,499). We’ll chart the median price per square foot, too. See what trends you identify (see chart).
Per foot median prices: Whitefish increasing in smaller size ranges; Bigfork increasing in middle size ranges; Lakeside big bumps in five out of six size ranges; Columbia Falls amazing consistency past two years; Kalispell inching up in five out of six size ranges; Polson inching up in two-thirds of size ranges.
Richard Dews is CEO of Glacier Flathead Real Estate, a Flathead-based real estate software and services company.