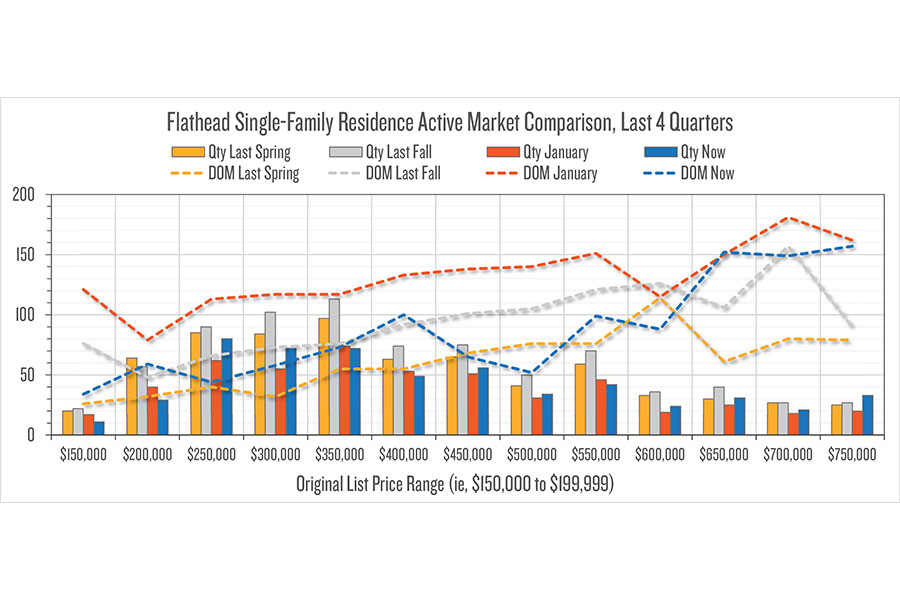
A third of the way through spring, how do the quantities of actively listed homes compare to prior quarters (see chart)? I’ve charted the quantities (bars) of homes active last spring (gold), last fall (grey), this January (orange) and now (blue) — by original list price ranges in $50,000 blocks. Findings: 1) availability of lower-priced homes keeps falling, 2) $250,000 to $349,999 home availability recovering from winter pull-back, 3) $350,000 to $749,999 about as thin as winter.
I also charted the median Days on Market (DOM), which are the number of days since listing. These are represented by dashed lines of the same color as their counterpart quantity bars. Findings: 1) substantial shrinkage in time-on-market since January, 2) $200,000 to $499,999 fairly parallel to the DOM of last fall, 3) higher-end homes on market longer that those last spring.
Richard Dews is CEO of Glacier Flathead Real Estate, a Flathead-based real estate software and services company.