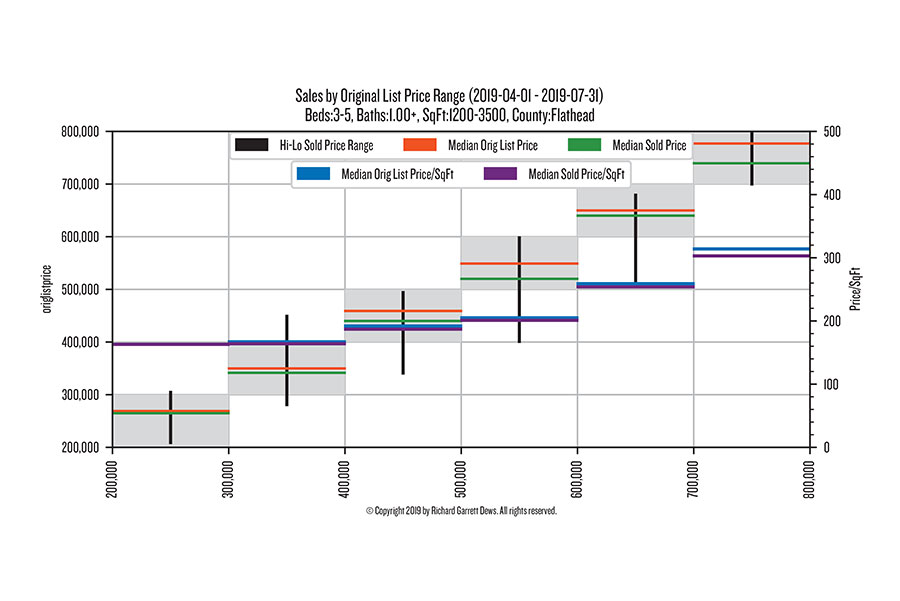
Last week we focused on the quantities of Flathead County home sales, over the past three years, specifically during the months of April through July. This week, let’s drill with specifics into pricing by square footage. The lower price range homes simply keep edging upwards, in terms of cost per square foot (see chart). Median original list prices, per square foot, are represented by the blue horizontal lines (per foot prices use the right side numbers, range of original list prices use the left side numbers). Purple horizontal lines represent the median sold prices per square foot. The takeaway might be that they are amazingly close together, for each range of original list prices, with a slight distance seen in the highest price range. Homes are often selling for prices extremely close to their original list prices. Looking back at last week’s quantity numbers, and median time from listing to contract, you may see that sellers have been very happy – broadly across the market – in 2019.
Richard Dews is CEO of Glacier Flathead Real Estate, a Flathead-based real estate software and services company.