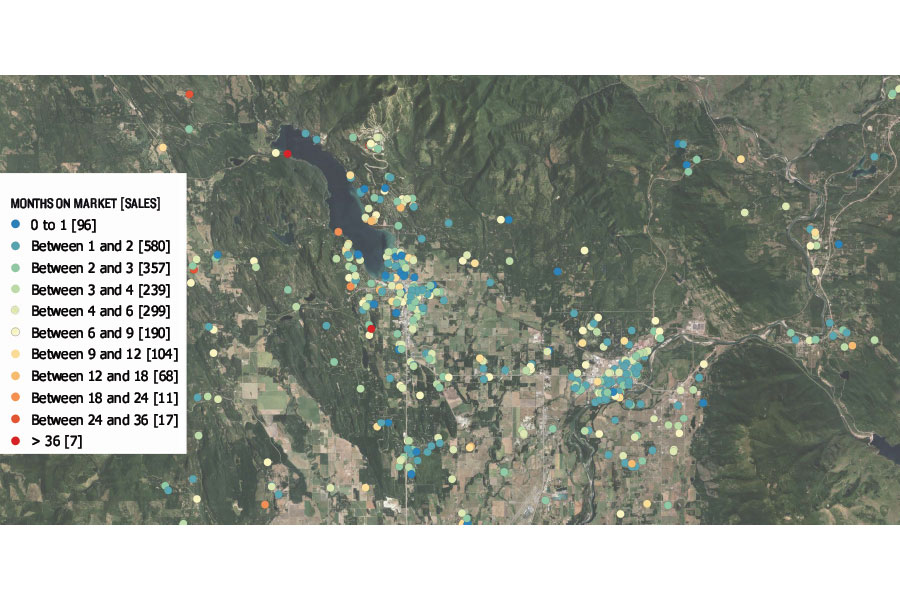
It’s one thing to look at bar charts and line graphs, depicting home sales activity. It’s another to represent the activity on a map (see graphic). Here we have the north valley single-family residence sales, over the past 12 months, depicted by location and days on market. The legend, on the left side, shows colors representing the range of months each home took to close. Bracketed numbers, at the end of each legend line, give the total number of sales in each range.
I tallied and depicted these for all of Lake and Flathead counties, but the dots were just too small to zoom out and show the entirety of both counties. So I zoomed into just the northern Flathead Valley. Take a look at those bracketed numbers; the lion’s share of homes were snapped up in just three months.
Richard Dews is CEO of Glacier Flathead Real Estate, a Flathead-based real estate software and services company.