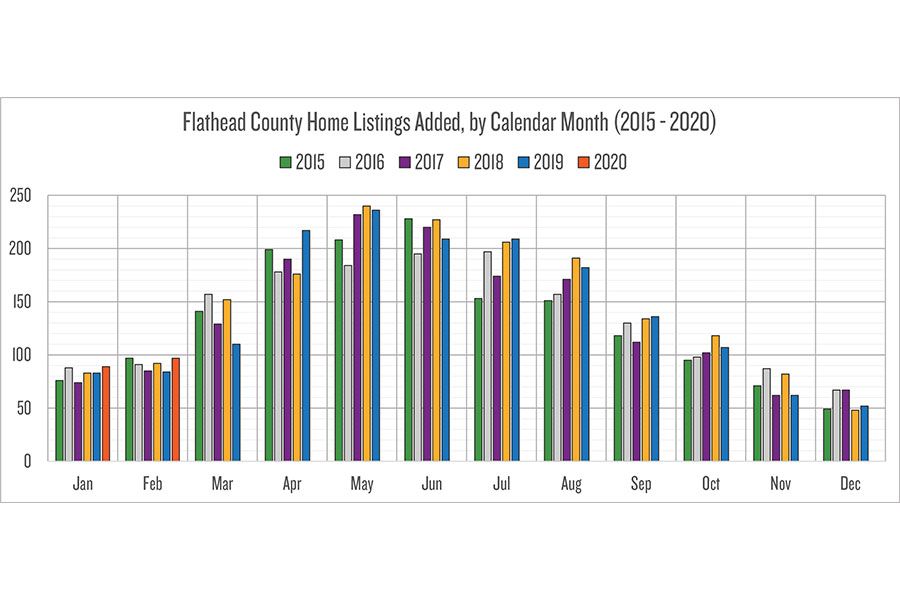
When do most homes hit the market, by calendar month (see chart)? This chart shows quantities of listings added by month, for homes listed for prices between $150,000 and $599,999, over the past five years. If you assumed that most enter the market in the summer, you’d be wrong; most are added to the market during the spring (fewest are added during the winter). So which year had the most listings added? By year: 1,586 (2015), 1,629 (2016), 1,618 (2017) , 1,749 (2018) and 1,687 (2019).
Last Friday, I had an enjoyable and educational conversation, with the hard-working folks at the Department of Revenue (DOR). Their public service is an endless (and often thankless) task of appraising property in the Flathead (to IAAO and USPAP rules and standards). Their workload tripled in recent years, now appraising properties every two years (instead of 4-6 years in the past), and I see tax valuations better tracking more recent market values. How can you contribute to the accuracy, comprehensiveness and recency of data for your property? Complete and return the form mailed by the DOR to participants after real estate transactions requesting property and transaction detail data.
Richard Dews is CEO of Glacier Flathead Real Estate, a Flathead-based real estate software and services company.