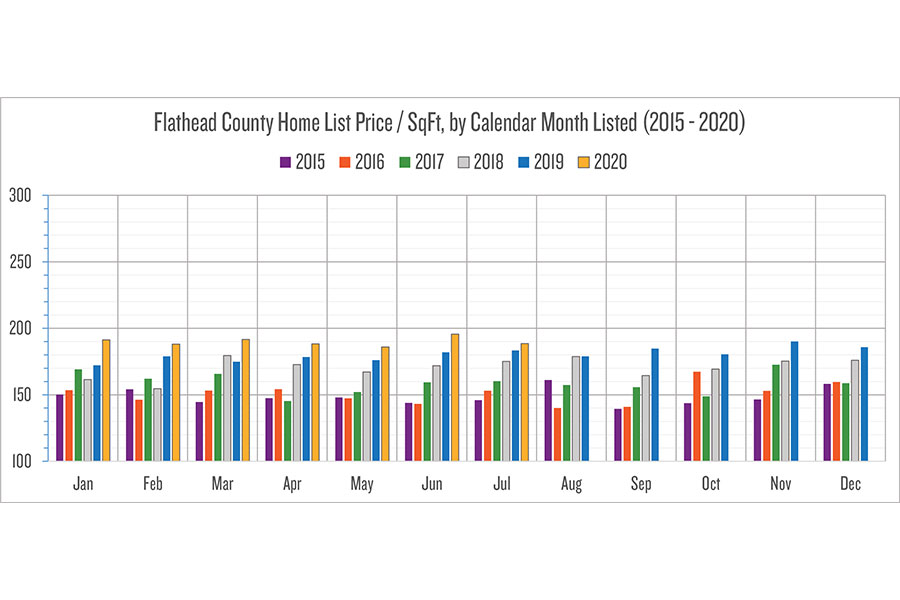
Back in March (and two updates in July), we looked at the median list price per square foot by month listed, over the past five years, for the major cities across the Flathead. We focused upon the volume sweet spot of homes listed for prices between $250,000 and $499,999. Let’s update the charts to show data through July (August numbers weren’t available until after my submission deadline). The printed Beacon allows only one chart – so we will print the Flathead County chart; the online Beacon will also have an animated GIF, showing all of the major cities.
These charts allow you to see differences across months listed and also over the years, spotting trends of price consistency, uptick, wild swings, etc. The blue bars represent 2019 prices, 2020 are in gold. I sorted the GIF slides by most-expensive (majority of months 2020) city. Whitefish tops, Columbia Falls again is second, Bigfork moderated (from 2019 to 2020, May through July), county upticks pretty consistently (as does Kalispell), Lakeside varies wildly due to property amenity diversity (wide-ranging choices), and Polson price-performs.
GIF (rotating charts):
Richard Dews is CEO of Glacier Flathead Real Estate, a Flathead-based real estate software and services company.