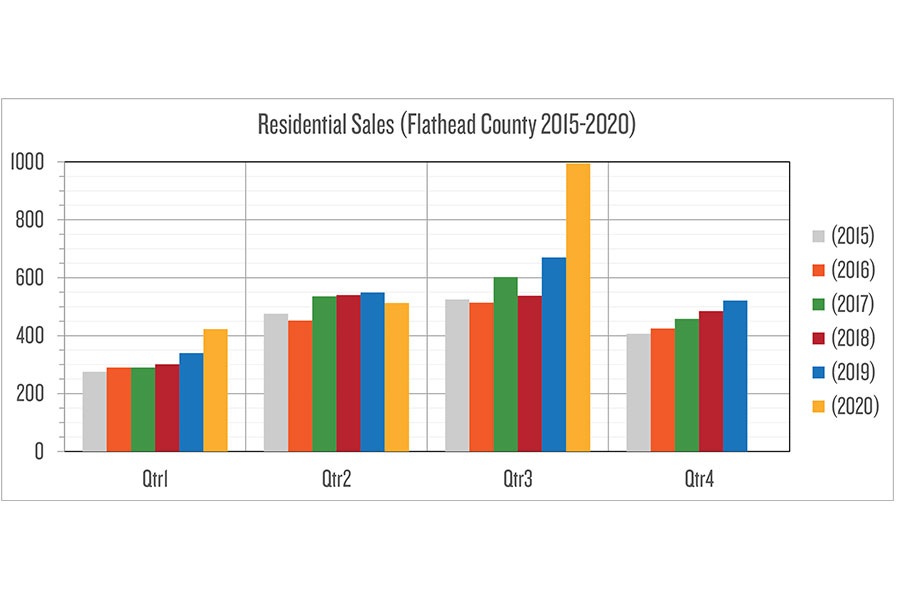
As we enter the fourth and final quarter of the year, we have data to review the first three quarters. So let’s do that, comparing the Flathead County residence and residential land parcel sales — by quarter — for the past six years.
The 2020 residence sales quantity for 3Q was so high that I had to change the scale maximum from 700 to 1,000. Forget any sense of a consistent growth curve and leap straight into “Oh my!” The number of residence sales nearly doubled, from 2Q and 3Q 2020. Comparing 3Q 2020 to 3Q 2019, it was a 48% growth. The online Beacon has an animated GIF graphic, showing the quarterly residential land parcel sales quantities, too.
For hard-copy readers, let me shock you with the residential land parcel sales counts for 3Q 2020. What had been a year-over-year slow rise (roughly 10% per year average) from 2015 through 2019 — pretty much exploded in 3Q 2020 to 995 (114% increase over 2Q 2020; 88% increase over 3Q 2019). Jack F. suggested I check the building permit counts, too. What do you think those counts have been doing?
GIF (rotating charts):
Richard Dews is CEO of Glacier Flathead Real Estate, a Flathead-based real estate software and services company.