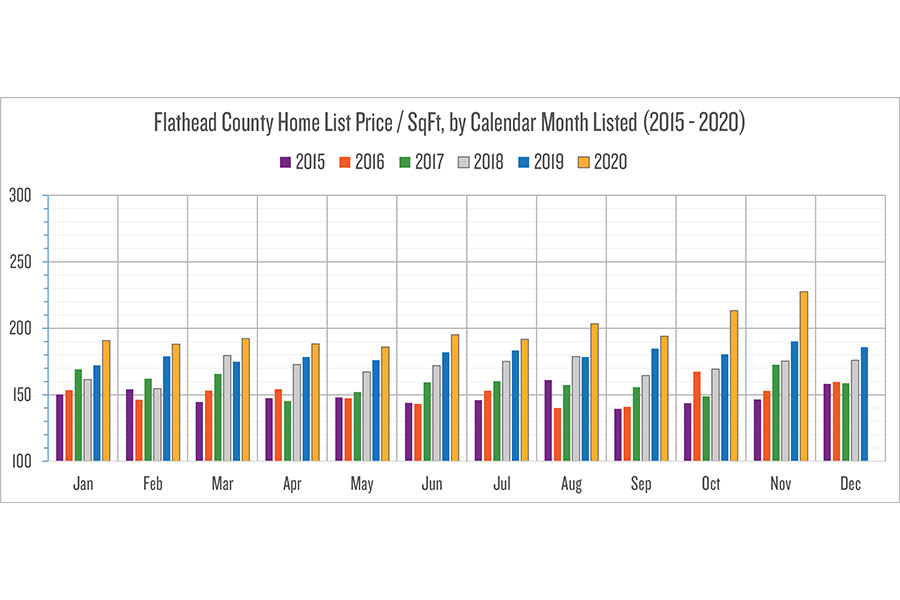
Back in September, we looked at the median list price per square foot by month listed, over the past five years, for the major cities across the Flathead. We focused upon the volume sweet spot of homes listed for prices between $250,000 and $499,999. Let’s update the charts to show data through November (December isn’t over yet). The printed Beacon allows only one chart, so we will print the Flathead County chart. This online version also an animated GIF below, showing all of the major cities.
These charts allow you to see differences across months listed and also over the years, spotting trends of price consistency, uptick, wild swings, etc. The blue bars represent 2019 prices, 2020 are in gold. I sorted the GIF slides by most-expensive (majority of months 2020) city. Whitefish pushes $300/foot in November, but it had some pull-backs this year over last. Countywide median keeps upticking each month of 2020 (largest increases were in October, November); Bigfork had five pull-backs this year over last; Kalispell had no pull-backs, and Polson price-performs again. Please have a safe holiday.
GIF (rotating charts by city):
Richard Dews is CEO of Glacier Flathead Real Estate, a Flathead-based real estate software and services company.