The bull trout population remains stable in Northwest Montana, according to state biologists who completed their annual inventory of spawning sites.
Montana Fish, Wildlife and Parks recently released the results of its annual survey of the Clark Fork, Flathead and Kootenai drainages, and the data shows that the bull trout population has not experienced any significant changes, Regional Fisheries Manager Mark Deleray said.
“In FWP Region One waters, bull trout redd numbers appear stable in all basins, being very similar to 10-year averages,” Deleray said. “In each basin, this year’s count may be slightly higher or lower than last year’s, but not significantly different than recent years.”
Each year, state biologists travel over 200 miles of streams and collect information from spawning areas, counting the number of spawning nests, called redds. Redd counts are indicative of the abundance levels of spawning adult bull trout each year. Redd counts are used to assess status and trends in bull trout populations in northwest Montana.
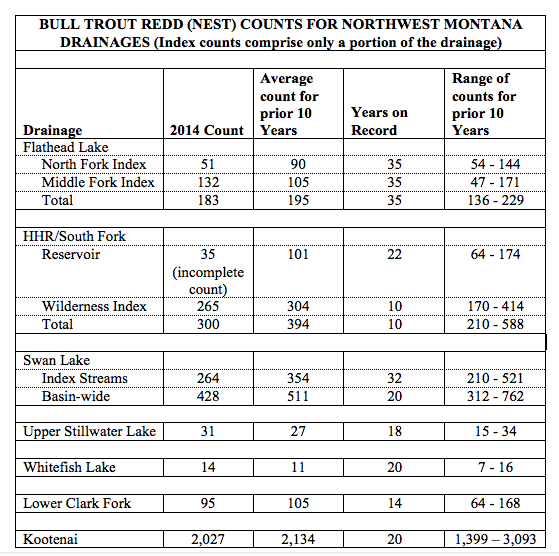
This was the 35th year of annual index counts for Flathead Lake bull trout. The index count consists of parts of eight streams and is a partial count for the basin. The count in the four North Fork streams over the past 10 years has ranged from 54 to 144, averaging 90 redds. The 2014 count of 51 is 43 percent below this 10-year mean, but similar to the counts of 54 in 2010 and 58 in 2012. These counts are comparable to the low counts in 1996 and 1997.
Deleray said low counts in three of these four streams could be the result of stream habitat changes, past research handling of juvenile bull trout, or other factors. Outside of the four North Fork index reaches, FWP counted over 100 redds in the Canadian North Fork and others in additional Montana North Fork tributaries.
Counts in the four Middle Fork reaches have ranged from 47 to 171 over the past decade, averaging 105 redds. The current count of 132 is higher than seven of the past 10 years and 26 percent above average.
The counts in recent years are similar to the high counts in the 1980s, Deleray noted. When combined, the eight-stream index count of 183 is similar to the average number — 199 — observed over the past 10 years.
Every three to five years crews count all 33 stream sections that are known to support bull trout spawning. This includes the upper main stem of the North Fork and six of its tributaries in British Columbia, two additional Middle Fork streams in Glacier National Park and 10 other Middle Fork tributaries in the Great Bear and Bob Marshall Wilderness areas.
Deleray said these basin-wide counts have shown that the eight index streams support about 45 percent of the annual bull trout spawning run out of Flathead Lake and allows FWP to estimate total redd numbers with a high degree of confidence. Using the 2014 index count of 183 redds, FWP estimates a basin-wide total of 407 this year.
Overall, redd counts for Flathead Lake appear stable, Deleray said.
In the South Fork, FWP has annually counted four tributaries draining directly into Hungry Horse Reservoir for the past 22 years. These streams support about 20 percent of total spawning in the South Fork drainage.
The 2014 count of 35 for the reservoir tributaries does not include Sullivan Creek, due to high flows and poor visibility following a rain event the day before we attempted this survey. Sullivan Creek has averaged 45 redds annually over the past ten years. The other 80 percent of bull trout spawning occurs in wilderness streams, which are logistically more difficult to count.
Field crews have surveyed four of these backcountry spawning streams 10 times since counts were initiated 22 years ago in 1993. FWP has only completed basin-wide counts in the South Fork Drainage twice, which included seven additional backcountry stream sections where spawning occurs, but is extremely limited.
The 2014 total of 300 redds is 24 percent below what FWP observed during the 10 years when comparable counts were completed. Deleray said the difference would have been smaller if Sullivan Creek could have been counted.
Index counts in four stream sections in the Swan Drainage have been completed annually for the past 32 years. With assistance from Plum Creek Timber Company and U.S. Forest Service personnel, FWP has completed basin-wide surveys in the Swan annually since 1995. This includes the four index sections plus an additional six streams. The 2014 basin-wide total does not include Soup Creek, which has averaged six redds annually during the past 10 years.
This year’s basin-wide total of 428 redds is 16 percent below the average over the last decade. Deleray noted the count represents a considerable increase over the 2013 count of 335.
In the recent six years, the Swan River redd counts appear to have stabilized around this lower level, Deleray said. Since 2009 efforts have been made to reduce the population of non-native lake trout in Swan Lake. Deleray said although identification of the exact mechanism is difficult, reductions in the number of redds in the Swan drainage are likely the result of competition/predation from lake trout and netting bycatch mortality from the lake trout suppression project.
Upper Stillwater Lake and Whitefish Lake support bull trout populations that are not part of the larger systems. Bull trout from Upper Stillwater Lake spawn in the Stillwater River upstream from Stryker and in Fitzsimmons Creek. Those from Whitefish Lake spawn in Swift Creek and the West Fork of Swift Creek.
FWP has monitored these populations in cooperation with the Department of Natural Resources and Conservation for the past 18 and 20 years, respectively.
Deleray said the 2014 counts in both of these systems were very similar to the average over the past 10 years. Redd numbers appear stable.
Bull trout inhabiting the lower Clark Fork River and the reservoirs behind Thompson Falls, Noxon Rapids and Cabinet Gorge Dams spawn in 18 accessible tributaries from the Thompson River downstream to Cabinet Gorge. Field crews have monitored spawning runs in these streams annually over the past 14 years.
The 2014 count of 95 redds is very similar to the annual average observed during the last decade. Overall redd numbers appear stable, Deleray said. Bull trout inhabiting the lower Clark Fork River spawn and rear in tributaries to Thompson Falls, Noxon and Cabinet Gorge Reservoirs. Approximately 18 accessible tributaries from eight major drainages are monitored annually by crews from FWP, AVISTA Utilities, Plum Creek Timber Company, and the USFS.
Over the past 20 years, bull trout redd counts have been completed on the Wigwam River and three other Kootenai River tributaries in Canada, the Grave Creek Drainage, the Quartz Creek Drainage, O’Brian, Pipe, Bear, the West Fisher and the Callahan Creek Drainage. This effort includes assistance from British Columbia.
The vast majority of bull trout from Koocanusa Reservoir and the Kootenai River upstream spawn in the Canadian tributaries. These tributaries in British Columbia accounted for an average of 94 percent of the annual spawning in the Kootenai Drainage over the past 10 years.
The 2014 count of 2,027 redds in the Kootenai drainage is very similar to the 10-year average of 2,134 redds, according to FWP.