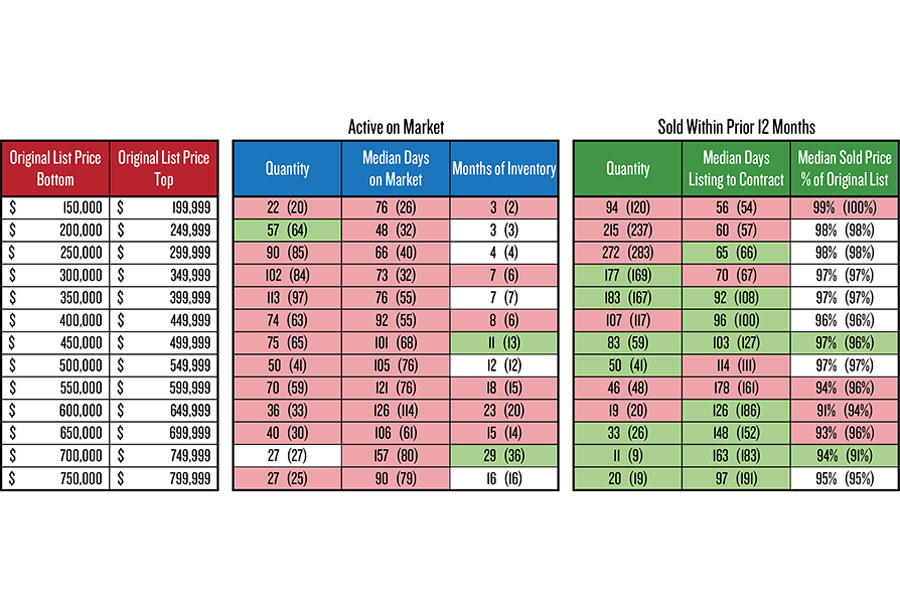
Let’s compare a new 12-month market snapshot (as of Oct. 11) to a similar snapshot taken on May 27. The graphic shows rows of original list price ranges, plus active property and sold property statistics for each range. Within each cell, the first number is the Oct. 11 snapshot statistic; the second number (in parentheses) is the comparative late May snapshot statistic. If the current number indicates more properties on the market, longer median days on market, and/or more inventory (when compared to the May 27 snapshot), I applied a reddish fill.
Conversely, if the current number indicates fewer candidates on the market, fewer median days on market, and/or less inventory (when compared to the May 27 snapshot), I applied a greenish fill.
Active properties October vs. May comparison: almost half of the ranges have more months of inventory, all ranges are longer on market, only 1 range has fewer properties on market.
Sold properties October vs. May comparison: over half of the ranges sold higher quantities, over half were faster from listing to contract, and over half had the exact same median sold price percentage of original list price.
Richard Dews is CEO of Glacier Flathead Real Estate, a Flathead-based real estate software and services company.