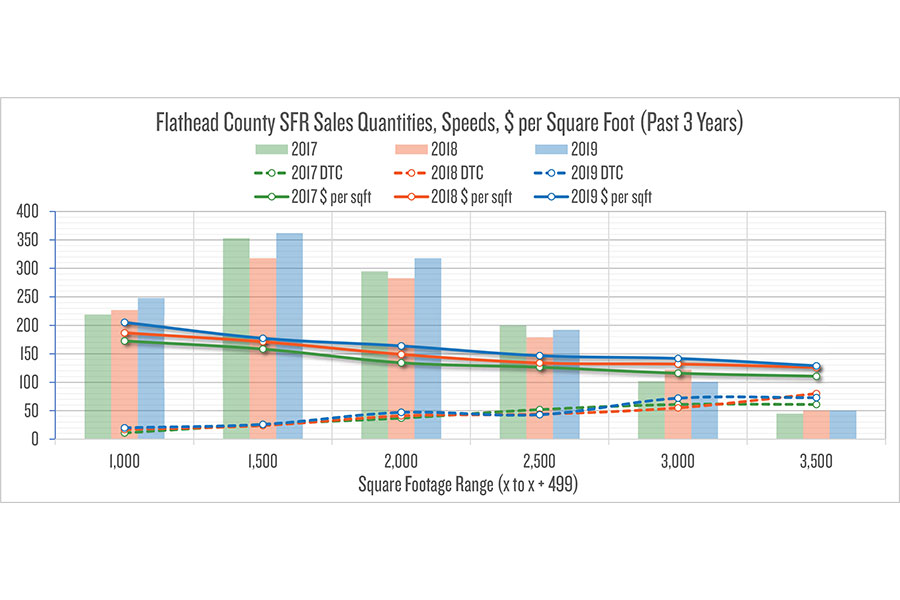
So much to say, but so little space on the page, so the hard copy chart will show data for Flathead County (animated GIF online will also show specifics for each city). Let’s look at single-family residence annual sales quantities, median days from listing to contract, and median cost per square foot, by square footage range (like 1,000 to 1,499), since 2017, for homes sold at prices between $150,000 and $699,999 (see chart).
2017 numbers are in green, 2018 are orange, and 2019 are blue. Vertical bars show quantity of sales, dashed lines show median days from listing to contract (add roughly another 45 for due diligence to get to closing), and solid lines show median sold price per square foot.
County-wide, the price per foot keeps inching up annually. It costs more per foot to buy smaller homes, and they are also snapped up more quickly. Polson is cheapest. You’re gonna want to see the online city specifics…
GIF (rotating charts with breakdowns by city):
