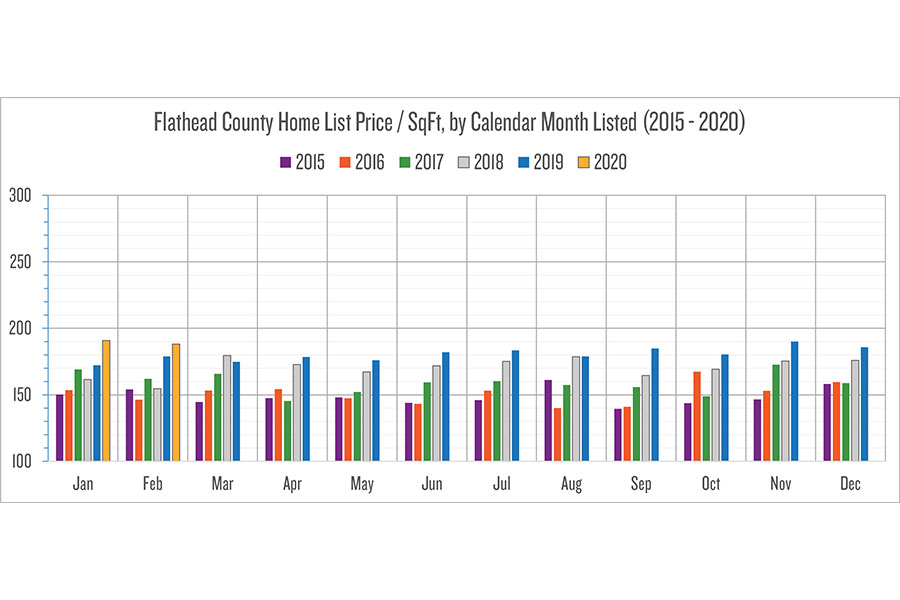
Last week, we looked at quantity of single-family residences listed (by listing month), over the past 5 years. This week, let’s drill further into the data, and see the median per square foot list price by month of listing (hitting market), over the past 5 years. This will focus upon the volume sweet spot, of homes listed for prices between $250,000 and $499,999. The printed Beacon allows only one chart – so we will print the Flathead County chart. The online version also has an animated GIF (found below), showing all of the major cities, too.
These charts allow you to see differences across months listed and also over the years, spotting trends of price consistency, uptick, wild swings, etc. The blue bars represent 2019 prices, and we only have 2020 monthly data for January and February so far. I sorted the GIF slides by most-expensive (majority of months 2019) city. Whitefish tops, Columbia Falls shocks (as second), Bigfork moderated (from 2018 to 2019), county upticks pretty consistently (as does Kalispell), Lakeside varies wildly due to property amenity diversity (wide-ranging choices), and Polson price-performs.
GIF (rotating charts, by city):
Richard Dews is CEO of Glacier Flathead Real Estate, a Flathead-based real estate software and services company.