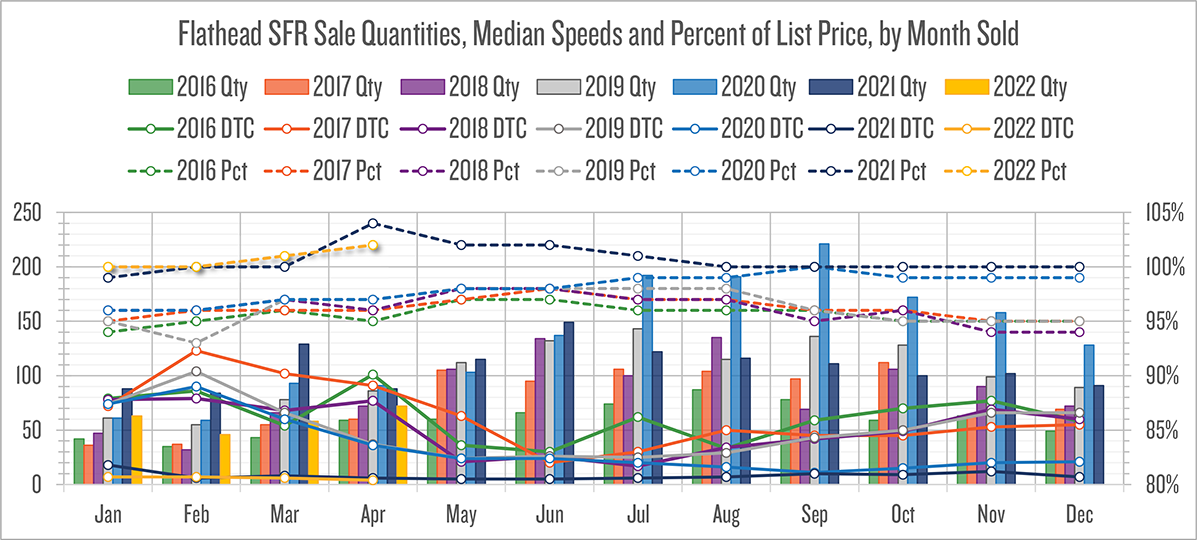
Looking at single-family residence sales by month sold, over the past seven years, let’s chart as clustered columns the quantities sold, as same-colored lines the median days from listing to contract, and as same-colored dashed lines the median percentage of sold price to original list price. Speaking first of quantity trends, July 2020 through March 2021 was a heightened period.
Quantity spikes pulled back to near-normal, by April 2021. Let’s compare next the speeds (median days from listing to going under contract), as same-color solid lines also using the left number axis: they really quickened from August 2020 and onwards. Finally, we’ll compare the median sale price percentage of original list price: at or above list, since February 2021.

© Copyright 2022 by Richard Garrett Dews. All rights reserved. Research based, in part, upon information from the Montana Regional MLS, LLC
Richard Dews is CEO of Glacier Flathead Real Estate, a Flathead-based real estate software and services company.