Home affordability is a function of effective purchasing power. In order to measure effective purchasing power it is necessary to consider household income, mortgage interest rates, property tax expense and typical mortgage loan availability and terms. This affordability graph assumes a homebuyer with the median household income in Flathead County with a 25 percent down payment and a 30-year home loan at the average interest rate for that year. The property taxes and insurance expense are estimated based on 1.5 percent of the median home price.
Using these variables it is possible to estimate how much a family with a median household income can afford to pay for a home in Flathead County each year and compare that to what the actual home prices have been over the last 20 years.
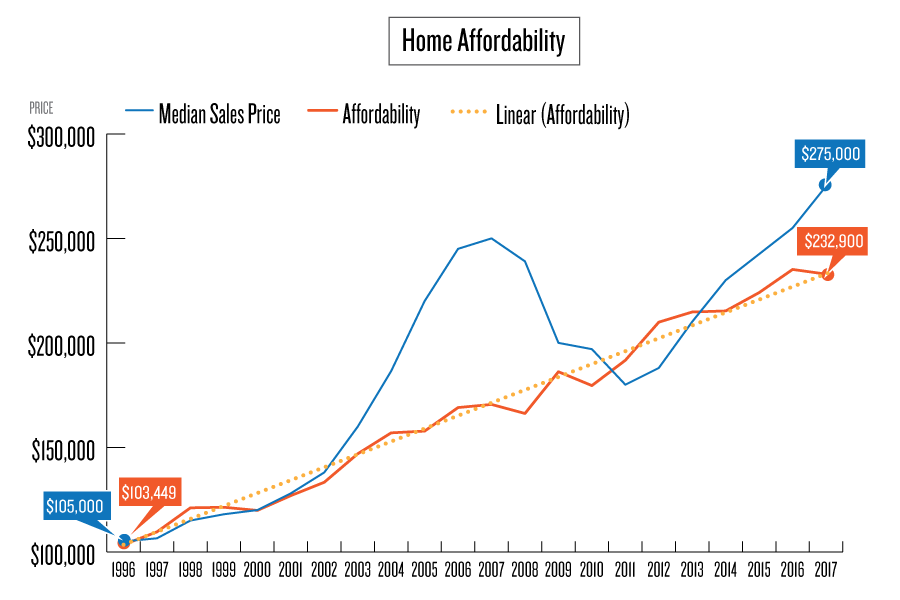
This graph shows that home affordability and prices were pretty well matched from 1984 to 2004. In 2005 the recent housing bubble started to develop, then topped out in 2007 with the start of the recent housing crisis. During that period, the median home price got completely out of line with what was affordable to the typical home buyer. Flathead home prices didn’t return to an affordable range until 2009 and 2010. Affordability then stayed relatively close to the median home price up until 2016, primarily because interest rates continued to drop. Over the last year interest rates started to increase, driving affordability down. In the last year the median home price has increased nearly 8 percent and affordability has decreased around one percent. Even with decreasing affordability, the number of sale is headed toward an all-time high in 2017.